Unit 2: ARTIFICIAL INTELLIGENCE


Acquiring information on artificial intelligence and knowledge engineering is

The table below shows in a tabular form the domain that relates to Artificial Intelligence and Knowledge Engineering consisting of the domain name, description (or brief definition of the domain), task performed and tools used for implementation.

Domain

Description

Task performed

Tools

Expert system

Uses formal logic rules to simulate human reasoning

Answering and solving complex problems and repetitive tasks

Experta or pyknow (using Python P/L) clips (using C P/L), pyke, nools

Supervised machine learning

An algorithm that learn from labelled data

Classification, prediction

Tensorflow, keras, sci-kit learn, xgboost, pytorch, pandas, numpy

Unsupervised machine learning

An algorithm that learn from unlabelled data

Segmentation, text classification, recommending content

Tensorflow, keras, sci-kit learn, xgboost, pytorch

Reinforcement machine learning

Learn from interactions with dynamic environment

Planning, online advertising, process control

PyBullet, dopamine

Artificial Neural Network (ANN)

Inspired and similar to the working of biological neurons and allow complex functions to be modelled from data

Image recognition, natural language processing (NLP)

Tensorflow, keras, sci-kit learn, MXNET

Natural Language Processing (NLP)

Uses text analysis techniques to understand human language

Language translation, text generation, text prediction, speech recognition, sentiment analysis

Nltk, spacky, textblob

Multi-agent systems

Simulate the behavoiur of several agents such as robots or people

Coordination and planning

Mesa spade

Data mining and Data warehousing

It sorts, uncovers, identify patterns and relationship that can solve business problem through large datasets

Biological data analysis, time series analysis, prediction, clustering, intrusion detection, predictive and descriptive data mining tasks

RapidMiner, kNime, Apache Hadoop, Tensorflow, keras, sci-kit learn

 HINT: The information here such as tasks and tools is not an exhaustive one but to give you a good fundamental knowledge of what Artificial Intelligence is all about theoretically and practically.


What is Machine Learning?

Machine learning is a subset of artificial intelligence that involve training dataset, build models using libraries like scikit learn, tensorflow, keras etc. related to statistical concept to solve and/or resolve a problem. The three basic types of machine learning is: supervised learning, unsupervised learning and reinforcement learning. Meanwhile there is also semi-supervised learning.

Task, input, output, algorithm done with the three (3) types of ML with simple definition in their approach


Supervised ML is used to build software applications that are based on classification systems such as (task/ use case IRIS CLASSIFICATION, (input: sepal, petal, output: setosa, virginica versicolor), object detection (face, face emotion, licensed vehicle plate number for example (task) face detector (input: still or moving image of face(s), output: a rectangle placed on the detected face)
Algorithm: support vector machine (svm), liner regression, Naive Bayes, Random Forest, Decision trees.

Supervised ML trains and tests labelled dataset to make prediction as the output. Both the input and output columns of the dataset are labeled. The labels will help explain the content of the dataset for the ML model. The output of supervised ML is more accurate than unsupervised ML.

Unsupervised ML is used to build software applications that are based on Recommendation systems (article, movie, video, product) such as (task/ use case ARTICLE RECOMMENDER SYSTEM, (input: text based object (article), output: article that relates with the article being read currently)
Algorithm: PCA, Guassian mixture model, K-Means or KNN.

Unsupervised ML trains and tests unlabelled dataset to make prediction as the output. Both the input and output columns of the dataset are not labeled.


Reinforcement ML is used to build software applications that are based on Robotic systems (robotic arm, self driving cars (or autonomous cars), playing games like chess, ludo with the computer) such as (task/ use case COMPUTER LUDO GAME, (input: dice to roll, output: number combination of dice, movement counted), robotics are used in manufacturing company to pick and place objects or items on pallette for proper arrangements.
Algorithm: Markov Decision Process (MDP), Deep Deterministic Policy Gradient (DDPG), Deep Distributed Distributional Deterministic Policy Gradient (D4PG)

Analogy to describe reinforcement ML: the best way to train a child is by using a reward system. You give the child a gift when he behaves well and you punish the child when he does something wrong. Note that a child will like to maximize the rewards hence he will always exhibit a good behavior all the time.

Reinforcement ML uses a reward system and finds a way to maximize the rewards. Recall when you play some computer games like Word search, word legend, you are given coins to unlock other treasures, this motivates the player to put in more best, this approach is also called a reward system. Recall, if you opt for guessing option, your coins will be reduced, and that's a penalty for the user.

Reinforcement ML serves as a forerunner for intelligent agent because it trains and tests the machine to learn from its environment, it makes the possible decision and returns a solution for a problem. 

Terms used in reinforcement ML makes up it components 

Environment: the environment sends information of the current situation to the agent, then the agent responds back, the environment sends a reward with the next situation (and a new state) to be handled by the agent again, this happens continuously. For example, the ludo board is the environment.

Agent: the agent interacts with the environment and takes actions that affects the environment  which can be used to reach the next (future) state. For example, the machine to play the ludo game is the agent.

Action: action is the dry of all possible moves (or operations) that the agent can make (from the set of all possible actions). Fro example when the machine turn 6-4, he can decide to bring out a new seed or count the previous seed(s).

State: state is the situation in which the agent finds itself. For example, after the machine roll dice, it will observe the current state of all the seeds position before making movements.

Reward: reward is the feedback sent to the agent by the environment (in order to validate the agent's action in each state). For example, when the machine overcomes a seed in the process of seed counting, it returns the opponents seed into its initial box and takes the opponent's position. The reward depends on both the action and state.

Policy: Policy is the solution of the Markov Decision Process (MDP), which aims to maximize reward at each state.


What is Python Library?


Python library is a collection of reusable codes (such as classes, methods, modules, packages etc) that you can include in your simple programs or complex programs (project) to perform specific tasks.

Using a library saves you time and a lot of headache, because you don't need to write all the code functionalities from the scratch. Invariably, instead of writing hundreds lines of code; with a library, your line of code will reduce drastically to something like 10-50 lines depending on the problem you are solving. 

Library makes your program tasks more efficient and effective. The related codes in the library are bundled together under one single name . For example import pandas as pd. The codes are bundled into the keyword "pandas" replaced with "pd".

Many libraries and modules come with the installation of Python itself, while others need to be downloaded separately. Once they are installed, they can be easily imported into your project, giving you direct access to additional functionality like performing advance computations, file I/O handling, data visualization, machine learning models/algorithm etc

Examples of python libraries

Numpy, Pandas, scikit learn (sklearn), tensorflow, keras, pytorch, matplotlib, seaborn, plotly-express etc

What is Dataset?

Machine learning uses dataset to train its model. A dataset is a collection of data acting as a sample to teach the machine learning model how to make prediction. Dataset is needed to train the model and to make prediction. Dataset acts like a database for storing features and also looks like a matrix consisting columns that represent a specific variable and rows that represent the field of the dataset for observation.
Dataset is stored in formats like xlsx, csv (comma separated values), json etc.

From the information above, we can say that Machine learning algorithms learn patterns that exist in a dataset containing some set of features and use these patterns to predict. 

Machine learning algorithm can only work with data represented as numbers, for example, in a signature authentication system, after the device scans the image, the scanned image is changed into numbers by the selected machine learning model, the model test the scanned image (acting as input) and produce a match / valid or no match / invalid as the output. Consequently, the trained model is mathematical function that maps the values of the features to the required target.

Secondly in the iris classification, of this mini project; the major features representing the Iris Classification are sepal length, sepal width, petal length, petal width, class_labels (setosa, versicolour and virginica). If we were to represent each flower as a number say setosa = 0, versicolour = 1, virginica = 2, the machine learning algorithm with no understanding of the concept of iris flower may interpret the flower after training and testing for prediction result.


I got the dataset called "iris.data" from the UCI machine learning repository (archive.ics.uci.edu/ml/dataset/iris).


Installing and Importing libraries (Using pandas as an example)

Installing: To install Pandas enter pip install pandas or pip3 install pandas in the terminal or command line. 

Importing: pandas (all lowercase) is a popular Python-based data analysis toolkit which can be imported using import pandas as pd.  The best way to import the pandas module in your program is by typing "import pandas as pd". This method imports the pandas module and gives it an alias 'pd', making it easier to reference in your code instead of typing "pandas" all the time in your code.

In order to train and test our ML algorithm or model, we need to import all the models into the program that comes under the particular library we are working on such as tensorflow, sklearn etc. We will also include some other functions from the library too such as read_csv() in pandas (to help load or open csv formatted files), dot() in numpy, pairplot() in seaborn, show() in matplotlib etc.


Three basic steps to make your dataset usable for your machine learning (ML) model

Step 1: Data collection means to get the data either raw (by preparing the dataset yourself) or getting the dataset from the internet.

Step 2: Data preprocessing means that you make sure the data in the dataset is clean and relevant for the specific task. Eliminate issues like missing values, incorrect format etc. Preprocessing data before applying it to a machine learning algorithm / model is important in the ML workflow. It helps to improve the accuracy, reduce the time and resources required to train the model, prevent overfitting, and helps to interpret  the model easily.

Step 3: Data annotation means you explain to the ML model what the dataset contains by adding meaningful labels to each data, then you use the annotated dataset to train and test your ML model for prediction

HINT: Ensure that the variables passed into the list of the python code match with the column name of the dataset

SAMPLE CODE

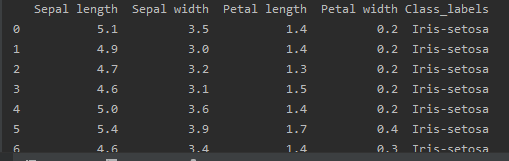
import pandas as pd

columns = ['Sepal length', 'Sepal width', 'Petal length', 'Petal width', 'Class_labels']

# Load the data

df = pd.read_csv('iris.data', names=columns)

# prints first 5 rows by default

print(df.head())

# prints first 10 rows

print(df.head(10))


OUTPUT OF IRIS DATASET: FIRST 10 ROWS FOR OBSERVATION


The iris dataset contains 150 samples of three species of Iris flower (or Iris plant species), the first column represent sepal length, the second column sepal width, the third petal length and the fourth petal width. The three species look alike but the difference in measurement can be used to classify them. The dataset is an example of supervised learning. The input variables are the the sepal and petal while the output variable are the three types of iris flower.
We are using this dataset because it is a simple dataset with no missing data, and we want to know how the model can predict the species (class-labels). This project will help Biologists to identify how to classify Iris plant species.
Classification is a machine learning technique used to predict group of membership for data observations or instances.

Workflow showing integral steps to implement Machine Learning


PYTHON IMPLEMENTATION FOR IRIS CLASSIFICATION

Version that worked

Pip show numpy    #to display the version of numpy library on the command prompt

Pip install numpy==1.20.2

When you install matplotlib, it automatically downloads latest version of numpy (it complains of float, float32, and int), uninstall it, and specify the numpy version that will work for your system.

Requirements

Numpy: 1.20.2

Matplotlib: 3.7.1

Pandas

Sklearn

Support Vector Machine (SVM) Algorithm

You can use pycharm to implement the codes and install the required libraries BUT if you want to use your phone, you can use Google Colab (it contains all the required libraries, all you need do is just to type the "import" keyword followed by the library name)

Software Requirement

This project is implemented in Python (version 3.8.0) and pycharm IDE. The other libraries used throughout the project are described below:

Pandas: Pandas is an open source library that provides tools for data mining and analysis using Python. It is mainly used to load and prepare the data for consumption by specific machine learning algorithms.

NumPy: NumPy is a Python library that can handle multidimensional data and perform scientific and mathematical operations on the data. NumPy was used in this project as an accessory to the Pandas library to perform some basic mathematical operations.

Matplotlib: Matplotlib is an open-source Python visualization library used for visualizing data from a given data in form of graphics such as bar chart, pie chart, line graph etc.

Streamlit: Streamlit is an open source library, a Python framework and dashboarding tool for building analytical responsive web interfaces, and allows python visualization, analysis and machine learning. You use Streamlit framework if you can your program to have a user interface (UI) rather than using the Console inteferace (Command Line Interface, CLI) to interact with the program.


Step 1 – Import each Library:

Phase 1

# phase 1

import numpy as np

import matplotlib.pyplot as plt

import seaborn as sns

import pandas as pd

from sklearn.metrics import accuracy_score

from sklearn.svm import SVC

from sklearn.model_selection import train_test_split


Step 2 – Load the data:

Phase 2

columns = ['Sepal length', 'Sepal width', 'Petal length', 'Petal width', 'Class_labels']

# Load the data

df = pd.read_csv('iris.data', names=columns)

# prints first 5 rows by default

print(df.head())

# prints first 10 rows

print(df.head(10))


Step 3 – Preprocess and visualize the dataset:


TIP: When the runs, it shows the seaborn image first, close it, to see the second image.

Phase 3

# Some basic statistical analysis about the data

print(df.describe())


Phase 4

It's a good practice to visualize the dataset before training and testing the required model / classifier.

# Visualize the whole dataset

sns.pairplot(df, hue='Class_labels')

plt.show()


Phase 5

# Separate features and target

data = df.values

X = data[:,0:4]      #set range from 0 to 3

Y = data[:,4]


# Calculate average of each features for all classes

# this is a list comphrension embedded with nested for loops

Y_Data = np.array([np.average(X[:, i][Y==j].astype('float32')) for i in range (X.shape[1])

 for j in (np.unique(Y))])

#to indicate 4 inputs and 3 species

Y_Data_reshaped = Y_Data.reshape(4, 3)

Y_Data_reshaped = np.swapaxes(Y_Data_reshaped, 0, 1)

X_axis = np.arange(len(columns)-1)

width = 0.25


# Plot the average

plt.bar(X_axis, Y_Data_reshaped[0], width, label = 'Setosa')

plt.bar(X_axis+width, Y_Data_reshaped[1], width, label = 'Versicolour')

plt.bar(X_axis+width*2, Y_Data_reshaped[2], width, label = 'Virginica')

plt.xticks(X_axis, columns[:4])

plt.xlabel("Features")

plt.ylabel("Value in cm.")

#plt.legend(bbox_to_anchor=(1.3,1))

plt.legend(bbox_to_anchor=(.25, 1.1), loc=2, borderaxespad=0.)

plt.show()


Step 4 – Train and test the model:


Phase 6

# Split the data to train and test dataset.

X_train, X_test, y_train, y_test = train_test_split(X, Y, test_size=0.2)


# Support vector machine algorithm

svn = SVC()

svn.fit(X_train, y_train)


Step 5 – Make prediction:

Phase 7

# Predict from the test dataset

predictions = svn.predict(X_test)

# Calculate the accuracy to 3 decimal places and multiply by 100

print("The accuracy of the SVM is {:.3f} %".format(accuracy_score(y_test, predictions)))


#testing the model

X_new = np.array([[3, 2, 1, 0.2], [  4.9, 2.2, 3.8, 1.1 ], [  5.3, 2.5, 4.6, 1.9 ]])

#new test by me

#X_new = np.array([[4.3, 2.0, 1.0, 0.1], [  7.9, 4.4, 6.9, 2.5 ], [  5.4, 3.5, 1.3, 0.2 ]])

#Prediction of the species from the input vector

prediction = svn.predict(X_new)

print("Prediction of Species: {}".format(prediction))


This Mini project is referenced from Iris Flower Classification Project using Machine Learning (https://data-flair.training/blogs/iris-flower-classification/)


#CODE MODIFIED BY AJALA

# phase 1

import numpy as np

import matplotlib.pyplot as plt

import seaborn as sns

import pandas as pd

import warnings

warnings.simplefilter("ignore")


# phase 2

columns = ['Sepal length', 'Sepal width', 'Petal length', 'Petal width', 'Class_labels']

# Load the data

df = pd.read_csv('iris.data', names=columns)

#print(df.head(10))


# phase 3

# Some basic statistical analysis about the data

#print(df.describe())


# phase 4

sns.pairplot(df, hue='Class_labels')

#hue parameter is used to visualize the data of different categories in one plot

#sns.pairplot(df, hue="Class_labels", height = 2, palette = 'colorblind');

plt.show()


#phase 5

# data preprocessing and label encoding

# change categorical data (non-numerical values) to numerical format

#import label encoder

from sklearn.preprocessing import LabelEncoder

lbc = LabelEncoder()

df['Class_labels'] = lbc.fit_transform(df['Class_labels'])

#display the preprocessed dataset

print(df.head())


#Phase 6

#model training

from sklearn.model_selection import train_test_split

#X represent the input features df['Sepal length', 'Sepal width', 'Petal length', 'Petal width']

# we drop the columns not related to the input features

X = df.drop(columns = ['Class_labels'])

#output column, add Class_labels column to the dataframe(df)

Y = df['Class_labels']


#test and split

xtrain, xtest, ytrain, ytest = train_test_split(X, Y, test_size= 0.30)


#import the model to be used from sklearn

#you can test other models too

# such as decision tree, svm, randomForest etc.

from sklearn.linear_model import LogisticRegression

selectmodel = LogisticRegression()

selectmodel.fit(xtrain, ytrain)


#print the accuracy of the model or algorithm selected

#store the prediction result in a variable called prediction

prediction = selectmodel.score(xtest, ytest)*100

print("Accuracy:: ", prediction)


#phase 7

#test new input features (by adjusting the features value to value from 0 to 9.9)

#testing the model

xnew_input = np.array([[2.5, 1.2, 1, 0.2], [  6.4, 2.2, 3.8, 1.1 ], [  4.2, 2.5, 4.6, 1.9 ]])

#Prediction of the species from the input vector

xnewprediction = selectmodel.predict(xnew_input)

print("Prediction of Species: {}".format(xnewprediction))


DATA PREPROCESSING

Data preprocessing is handled by the Pandas python library, data preprocessing involves the following:

- label encoding: to convert non-numerical values into numerical value (because the machine do not understand string of characters except numbers)

- handling missing values: missing values can negatively affect the prediction, hence we can replace missing values using mean, media, mode method.

- selecting appropriate column(s): you can select one or more columns needed for analysis

- performing normalization: this is when a plot diagram shows a left or right skew, so to normalize it, we need to apply log transformation to make the plot a normal distribution as done in statistics


SAMPLE OF HOW TO USE SOME OTHER MODELS (then modify the selected model line of codes section)

#svc
from sklearn.svm import SVC
selectmodel = SVC()

#decision tree
from sklearn.tree import DecisionTreeClassifier
selectmodel = DecisionTreeClassifier()

#random forest
from sklearn.ensemble import RandomForestClassifier
selectmodel = RandomForestClassifier()


TO CHECK FOR NULL VALUE AND REPLACE MISSING VALUES
df.isnull().sum()

how to handle missing value using mean or median or mode
mean and mode handles float and integer datatype while mode handles float, integer and string datatype, hence mode is more suitable and frequently used. But you can also use mean or median.
we will use fillna() funciton, inplace parameter to replace missing values if found
sample

#To insert the mode value of each column into its missing rows:
df['columnVal'].fillna(df['columnVal'].mode()[0], inplace = True)

#aliter: without inplace parameter
df['columnVal'].fillna(df['columnVal'].mode()[0])

#To insert the mean value of each column into its missing rows:
df['columnVal'].fillna(df['columnVal'].mean()
#aliter
df.fillna(df.mean(numeric_only=True).round(1), inplace=True)

#To insert the median value of each column into its missing rows:
df['columnVal'].fillna(df['columnVal'].median()
#aliter
df.fillna(df.median(numeric_only=True).round(1), inplace=True)

NB: you can use for loop to fill multiple columns too

Comments

Popular posts from this blog

Basic Web Page - phase 1